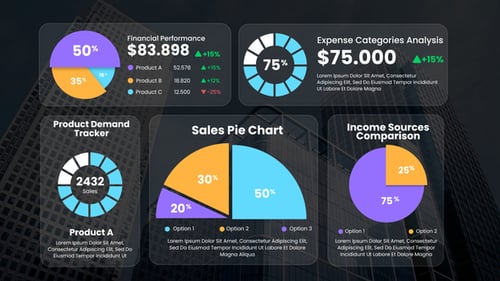
Infographic Pie Chart 250+
By OPTIMIZATOROne great value subscription from €14.50/month
- Unlimited downloads of 27+ million creative assets
- AI Tools: video, image and more
- Lifetime commercial license
- Easy cancellation
Already have an account? Sign in
Attributes
- Resolution
- Resizable
- File Size
- 126 MB
- Application Supported
- After Effects
- Required Plugin
- None required
- After Effects Versions
- CC, CS6, CS5.5
- Commercial License
- Further Information
Description
This template offers a versatile collection of animated pie charts and circular progress indicators designed for clear and impactful data visualization. Showcase percentages, statistics, and key metrics with dynamic motion graphics. Each chart type features clean lines, vibrant colors, and smooth animations, making complex data easily digestible for your audience. Ideal for corporate presentations, business reports, financial analysis, marketing campaigns, or educational content, this pack allows users to effectively communicate sales figures, customer growth, market shares, and other numerical information. Easily customizable to match project branding and data requirements.