
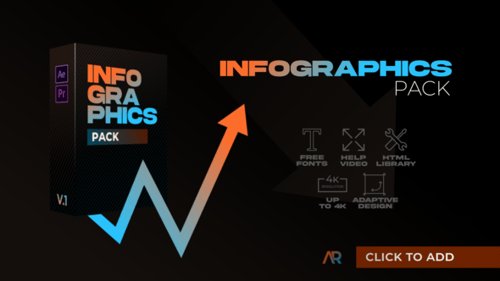
Infographics Pack | MOGRT
By Real-MotionOne great value subscription from €14.50/month
- Unlimited downloads of 27+ million creative assets
- AI Tools: video, image and more
- Lifetime commercial license
- Easy cancellation
Already have an account? Sign in
Attributes
- Length
- 1:00
- Resolution
- Resizable
- File Size
- 31 MB
- Application Supported
- Premiere Pro
- Required Plugin
- None required
- Commercial License
- Further Information
Description
Visualize key metrics and communicate data effectively with this dynamic infographic template. Featuring a wide range of animated charts, graphs, and statistical displays, this pack is designed for corporate presentations, business reports, and digital dashboards. From line graphs tracking sales history to pie charts illustrating capital distribution and radar charts comparing soft skills, each element is crafted with a clean, modern aesthetic. The smooth animations and precise data representation make complex information easy to understand, while customizable elements ensure seamless integration into any project. Elevate your data storytelling with these professional and engaging motion graphics.


